Home
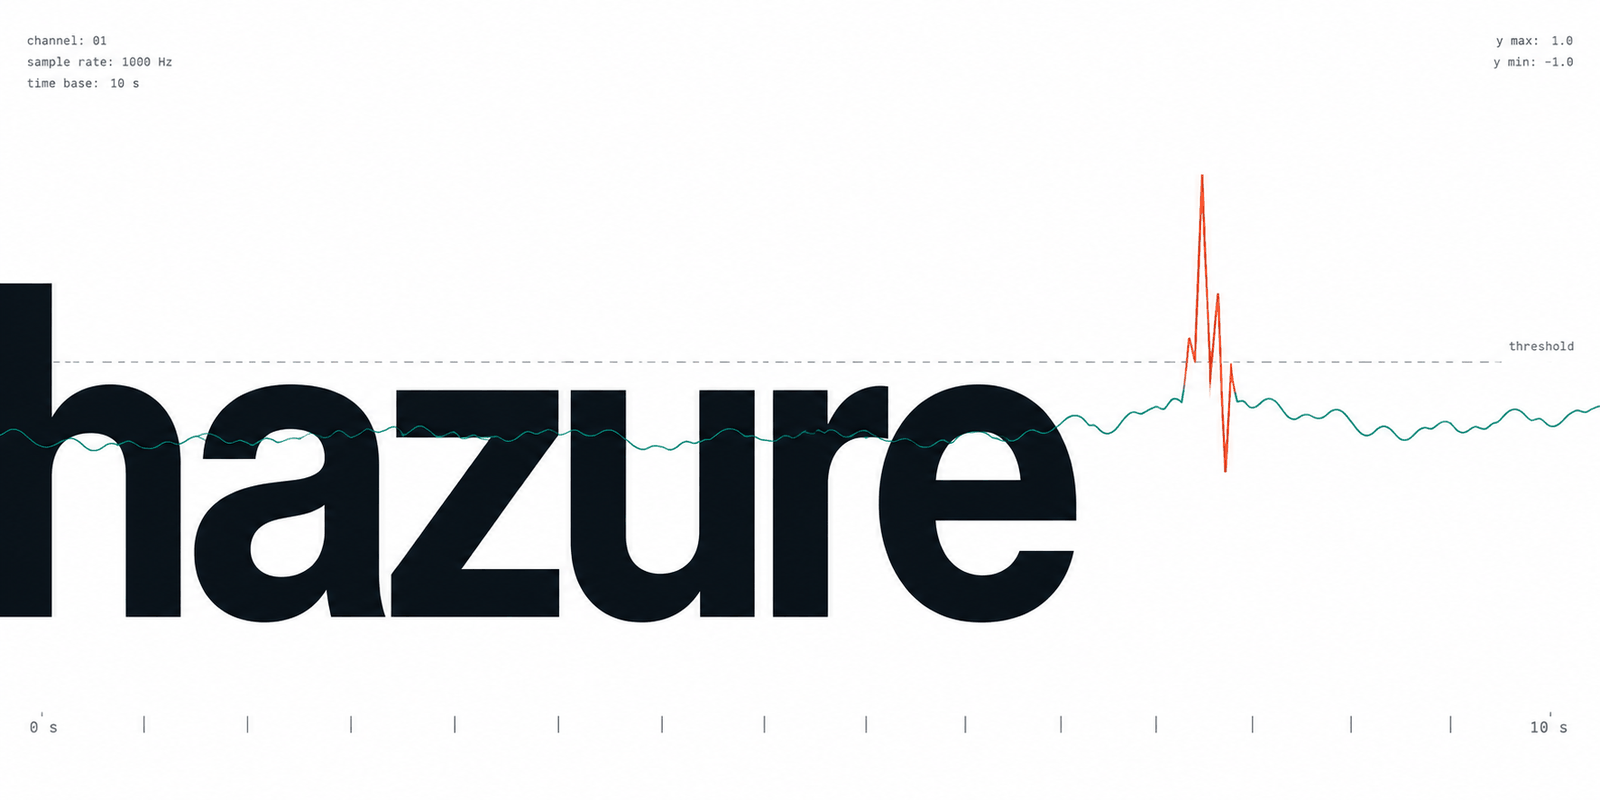
You have a metric — requests per second, queue depth, a sensor reading — you
suspect it occasionally misbehaves, and you have no record of when it did.
hazure finds those moments: rule-based and unsupervised detectors that learn
what "normal" looks like from the series itself, and that say where it stopped
holding.
import numpy as np
import pandas as pd
from hazure import detectors

index = pd.date_range("2024-03-01", periods=24 * 21, freq="h", name="time")
traffic = pd.Series(100 + 40 * np.sin(np.arange(504) / 3.8), index=index, name="rps")

labels = detectors.seasonal(period=24).fit_detect(traffic)
labels sits on the same time axis as traffic: 1.0 anomalous, 0.0 normal,
NaN unknown, in the same dataframe flavour it went in as. The
quickstart plants a real anomaly and takes it from there.
Shape of the library
Everything is a component with fit plus one verb:
| Type | Takes | Gives | Verbs |
|---|---|---|---|
Scorer |
a series | a continuous score | .score(), .fit_score() |
Threshold |
a score | binary labels | .apply(), .fit_apply() |
Detector |
a series | binary labels | .detect(), .fit_detect() |
Transformer |
a series | a series | .transform(), .fit_transform() |
Aggregator |
several columns | one column | .aggregate() |
Scoring and thresholding are separate because they answer separate questions:
one threshold policy is reusable across every scorer, a scorer can be swapped
without revisiting the policy, and a score is useful on its own for ranking.
A Detector is exactly one scorer and one threshold, and every function in
hazure.detectors returns one — so a ready-made detector can be printed,
reconfigured by name (set_params(scorer__window=48)) and stored, like one you
assembled yourself. Pipeline chains components; Graph wires them when the
model branches.
| Module | Holds |
|---|---|
hazure.detectors |
ready-made detectors, one function per kind of anomaly |
hazure.scorers |
continuous scores |
hazure.thresholds |
turning a score into labels |
hazure.transformers |
feature engineering and the rolling-window engine |
hazure.ensemble |
combining several verdicts or scores |
Where the dependencies sit
narwhals and numpy at runtime, and nothing else. pandas, polars, pyarrow,
scipy, statsmodels, scikit-learn, stumpy, ruptures and matplotlib are extras,
imported lazily by the algorithms that need them — so importing hazure never
pulls in a plotting stack you were not going to use. Python 3.11 and newer, fully
typed, MIT licensed.
Read next
- Quickstart — one planted anomaly, end to end: generate, detect, convert to intervals, score, plot.
- Guide — the component types, which detector suits which kind of anomaly, univariate versus multivariate, and the two behaviours that surprise people most.
- How it works — the mathematics of every scorer, threshold and metric, and where each one's assumptions run out.
- API reference — every public name, module by module.